datasette-vega 0.7
Datasette‑vega 0.7 updates the long‑dormant plugin for Vega‑Lite visualizations, adding compatibility with the latest Datasette alphas and supporting Datasette Lite’s new JavaScript plugin capability.
Introduction
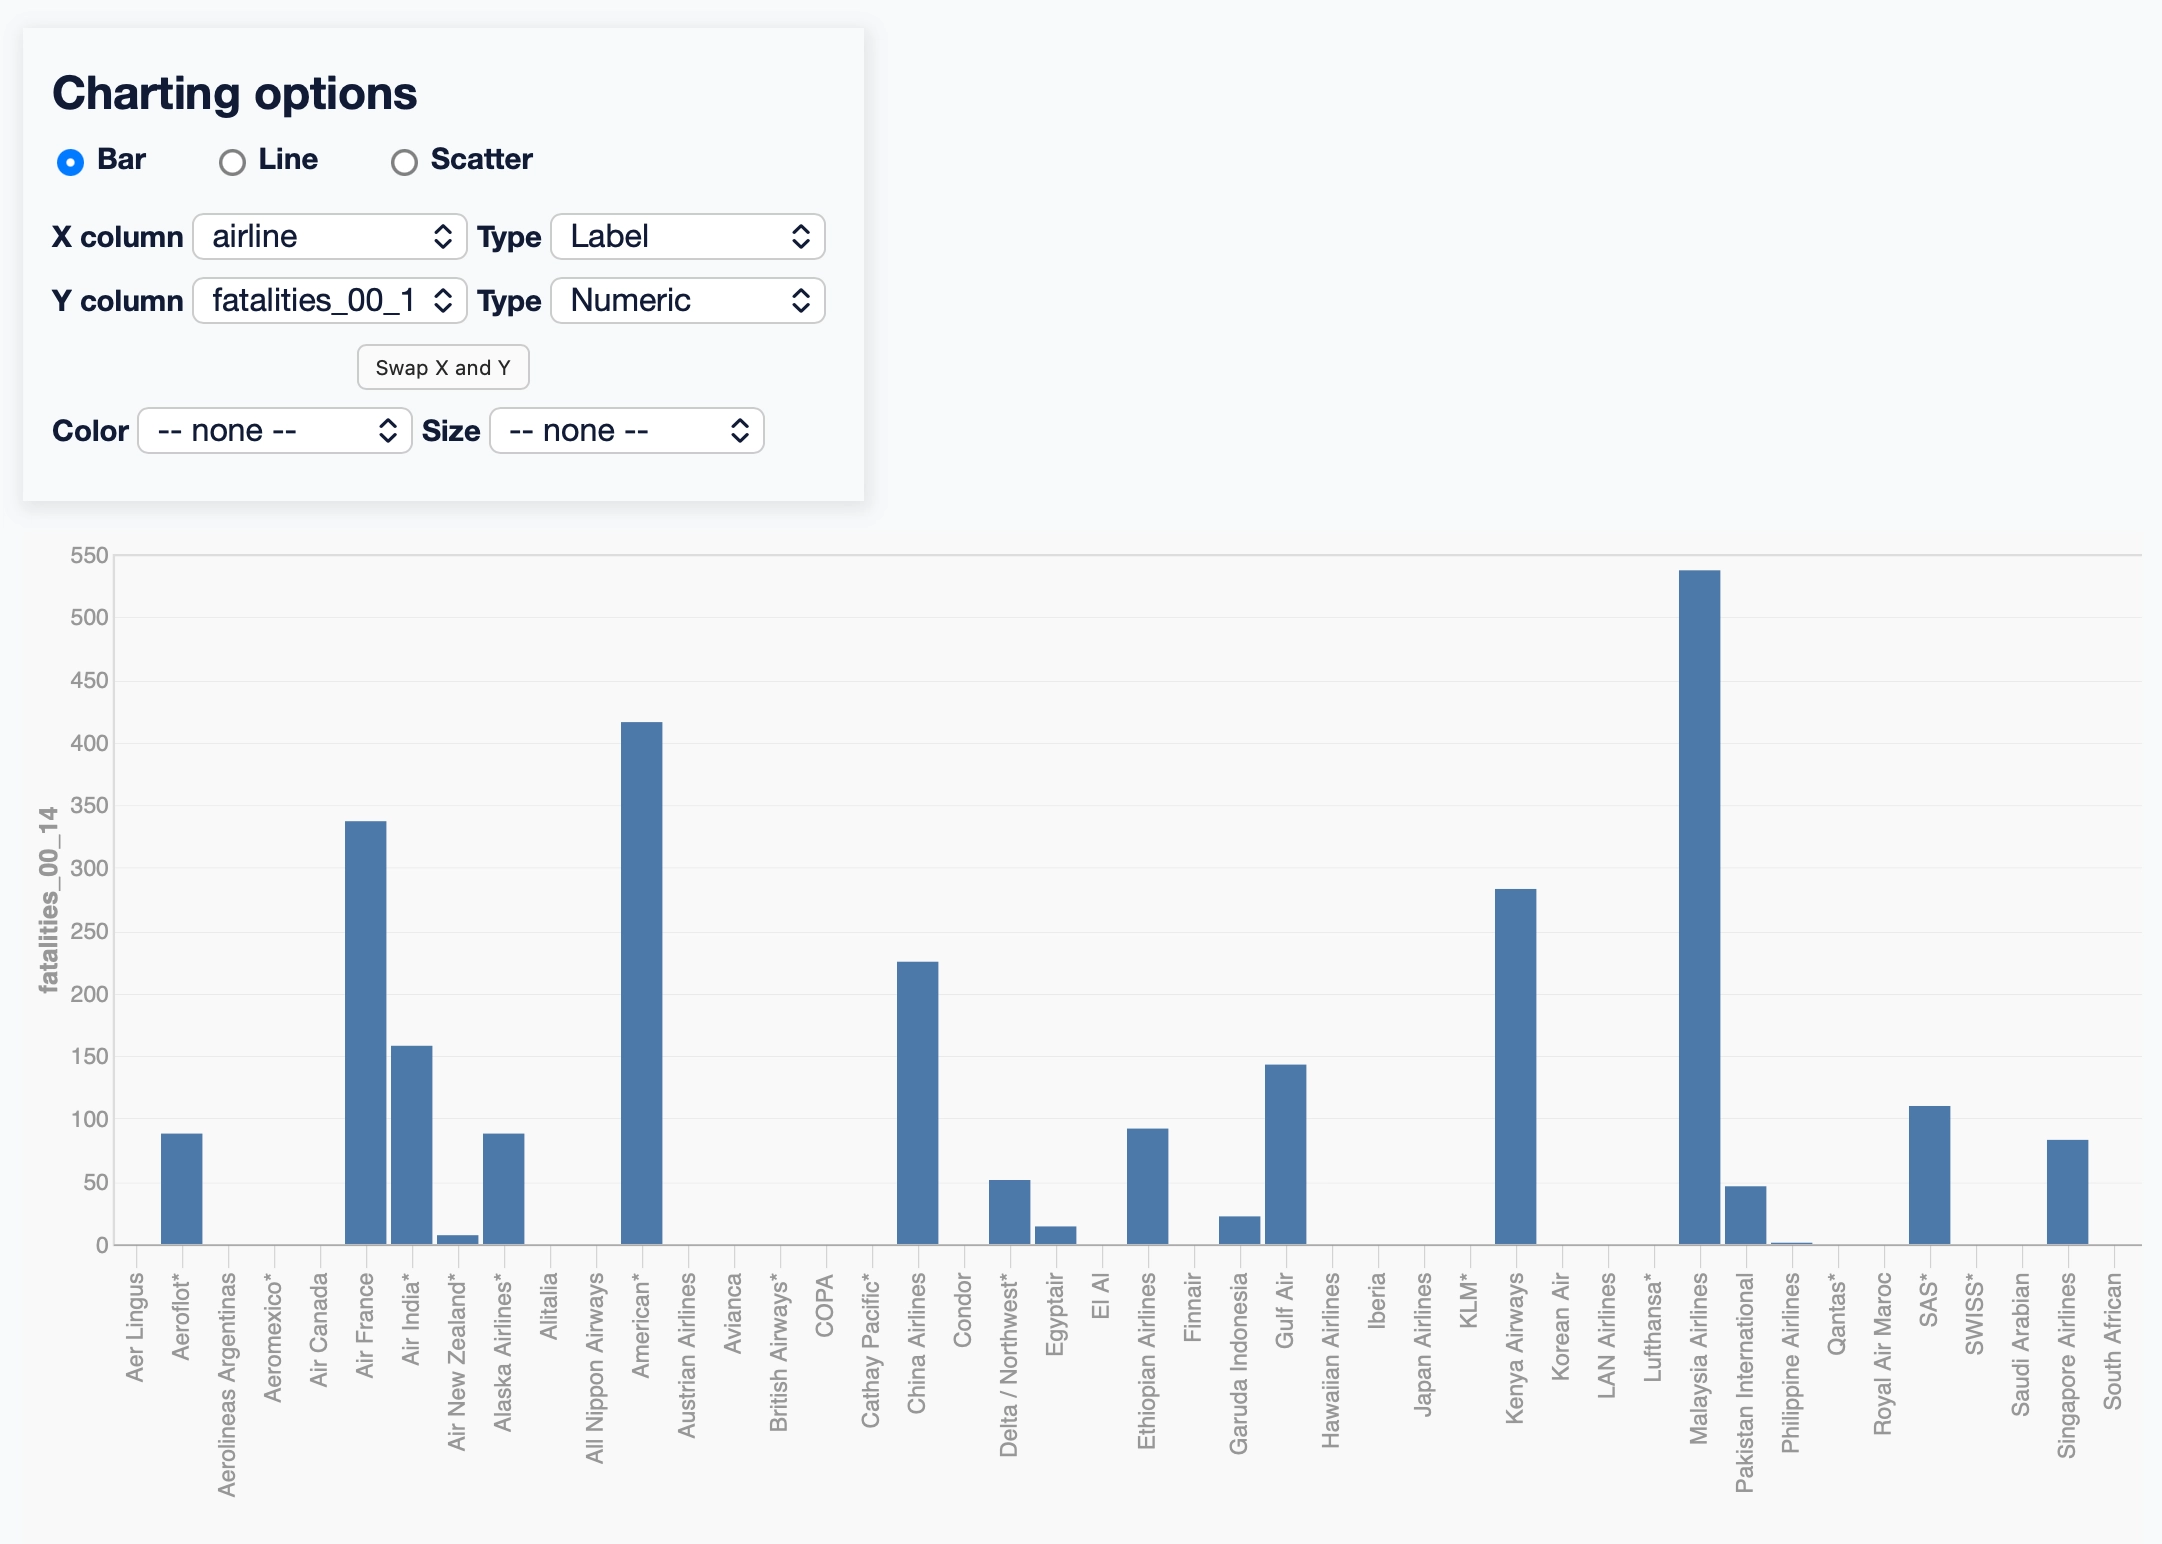
The open‑source community gets a fresh boost with the release of datasette‑vega 0.7. After an eight‑year hiatus, this Datasette plugin—designed to render Vega‑Lite charts directly from tables or custom queries—has been updated for modern Datasette versions and, crucially, now works with Datasette Lite. The upgrade brings both technical compatibility and a handful of usability tweaks, making it easier than ever to embed interactive visualizations in lightweight, client‑side deployments.
Compatibility with the latest Datasette alphas
The most significant change in version 0.7 is the alignment with the current Datasette alpha releases. Earlier versions of datasette‑vega relied on APIs that have since evolved, causing breakage for users on newer Datasette builds. The update rewrites the plugin’s internal calls to match the latest plugin interface, ensuring that charts render correctly without manual patches. This means developers can now upgrade their Datasette installations to the newest alphas without worrying about losing charting functionality.
Support for Datasette Lite and JavaScript plugins
Datasette Lite recently gained the ability to load JavaScript plugins, a feature that opens the door for client‑only visualizations. datasette‑vega 0.7 takes advantage of this capability, allowing Vega‑Lite charts to be generated entirely in the browser. The live demo linked in the README now points to a Datasette Lite instance, showcasing how the plugin can be used without a server‑side Python environment. This is especially useful for static site generators, educational notebooks, or any scenario where a lightweight, zero‑install deployment is preferred.
Cosmetic and usability improvements
Beyond the core compatibility work, version 0.7 includes several polish items:
- Improved default styling – chart containers now inherit a subtle margin and font settings that better match the default Datasette UI.
- Simplified configuration – the plugin’s JSON schema has been tidied, reducing the number of required fields for a basic chart and making the documentation clearer.
- Enhanced error handling – clearer messages are displayed when a query returns no data or when the supplied Vega‑Lite spec is malformed, helping users diagnose issues faster.
These refinements may seem minor, but they lower the friction for newcomers and streamline the workflow for experienced users.
Getting started with datasette‑vega 0.7
- Install the plugin – run `datasette install datasette-vega==0.7` (or add it to your `requirements.txt`).
- Add to your Datasette configuration – include the plugin in the `plugins` list of your `metadata.json`.
- Create a Vega‑Lite spec – either embed a JSON spec directly in a markdown cell or reference a saved spec file.
- Render the chart – navigate to a table or custom query URL and append `?_vega=spec.json` (or use the UI button that appears when the plugin is active).
- Try the demo – the README now links to a live Datasette Lite instance where you can experiment with sample datasets and see the plugin in action.
Practical considerations
While the plugin works seamlessly in most environments, keep the following in mind:
- Browser performance – Vega‑Lite renders charts using JavaScript; very large datasets may cause slowdown on low‑end devices. Consider limiting rows with a `SELECT` statement or using aggregation.
- Security – as with any client‑side script, ensure that the data you expose does not contain sensitive information. Datasette Lite does not enforce server‑side access controls.
- Version alignment – if you are using a stable Datasette release rather than an alpha, verify that the plugin’s compatibility matrix includes that version; otherwise, stick to the latest alpha for full feature support.
Conclusion
datasette‑vega 0.7 revitalizes a beloved plugin, bridging the gap between powerful Vega‑Lite visualizations and the modern, lightweight Datasette ecosystem. By supporting the newest Datasette alphas and enabling use within Datasette Lite, the update expands the reach of interactive charts to a broader set of developers and data storytellers. Install the plugin, explore the live demo, and start turning tabular data into compelling visual narratives with minimal setup.
Source
Read original sourceWhy we picked this
Datasette-Vega plugin update for charting AI data, enhancing AI data visualization