Beyond tree cover: mapping the world’s forest types
Google DeepMind and partners released a 10‑meter global Forest Typology map that distinguishes six forest types and tracks their changes from 2017‑2025, enabling more precise conservation and compliance with regulations.
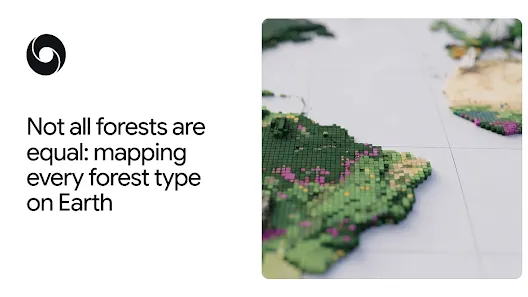
Beyond Tree Cover: Mapping the World’s Forest Types
Understanding what kind of forest we are looking at is essential for climate mitigation, biodiversity protection, and regulatory compliance. Traditional tree‑cover maps only tell us whether vegetation is present, but they cannot differentiate a pristine rainforest from a monoculture plantation. The new Forest Typology (ForTy) 2020 dataset changes that by classifying every 10‑by‑10‑meter pixel on Earth into six distinct forest and land‑use categories and providing an annual time series from 2017 to 2025.
---
Why "tree cover" Isn’t Enough
All forests store carbon and host the majority of terrestrial species, yet their ecological value varies dramatically with history and management. A primary forest that has never been logged stores more carbon and supports richer biodiversity than a fast‑growing timber plantation harvested every decade. Policies such as the European Union’s Deforestation‑Free Regulation (EUDR) require detailed knowledge of forest type—not just the presence of trees—to certify commodities like coffee, cocoa, and palm oil. ForTy supplies that missing layer of information, allowing regulators and companies to distinguish natural forests from planted or agricultural land and to see what replaces a forest after harvest.
---
How ForTy Classifies the Landscape
The map follows the UN Food and Agriculture Organization’s definitions and sorts land into six classes:
- Primary forest – native, undisturbed forest.
- Naturally regenerating forest – forest that regrew on its own after disturbance.
- Planted forest – intentionally seeded or planted, managed over long cycles.
- Plantation forest – intensively managed, single‑species tree farms.
- Tree crops & agroforestry – farms growing oil palm, rubber, cocoa, fruit, etc.
- Other land – grasslands, croplands, urban areas, water bodies, and more.
Training the model required a massive labeled dataset of ~1.7 million points drawn from expert surveys, national inventories, and targeted reviews of difficult cases. The model leverages AlphaEarth Foundations embeddings, compact summaries of multi‑year satellite observations, to capture subtle cues such as planting patterns, growth cycles, and harvest rhythms that differentiate the classes.
---
Accuracy, Transparency, and Flexibility
Independent validation with over 9,000 random sites showed 90 % accuracy in assigning the correct forest type and 95 % accuracy in separating forest from non‑forest, outperforming existing global products. Rather than a binary label, ForTy provides a probability score for each class, letting users set thresholds that match their risk tolerance. For example, a company seeking strict EUDR compliance might only accept pixels with high confidence, while a researcher estimating total forest extent could incorporate the full probability distribution.
---
From Snapshots to a Story of Change
A single‑year map is a useful baseline, but forests are dynamic. The accompanying time‑series dataset (2017‑2025) records annual transitions, revealing hidden conversions such as natural forest → timber plantation or abandoned farmland → regrowing forest. These transformations are often invisible in conventional tree‑cover maps because the land quickly turns green again after planting. By exposing both losses and gains, the time series helps pinpoint where conservation interventions are succeeding and where further action is needed.
---
Putting ForTy to Work
Both the 2020 map and the early‑release time series are freely available on Google Earth Engine under an open license. Potential applications include:
- Building deforestation‑free supply chains for commodities.
- Directing forest‑related finance to areas of greatest need.
- Supporting national and regional monitoring under the EU Deforestation Regulation.
- Enabling scientific studies of carbon stocks, biodiversity, and land‑use change.
The project is part of Google’s broader AI for Nature portfolio, which also tackles driver mapping, deforestation risk forecasting, species‑distribution modelling, and field biodiversity monitoring.
---
Looking Ahead
The ForTy team plans to refine the time series, expand validation, and incorporate user feedback. By making high‑resolution, type‑specific forest data openly accessible, the initiative aims to empower governments, businesses, NGOs, and researchers to protect the world’s most valuable forests more effectively.
---
ForTy demonstrates how AI‑driven remote sensing can move us beyond simple tree‑cover counts toward a nuanced, actionable understanding of the planet’s forested landscapes.
Source
Read original sourceWhy we picked this
Shows AI-driven environmental mapping by DeepMind, a notable application.